We use cookies to improve your browsing experience and provide meaningful content. Read our cookie policy. Accept
  •  Customer Login
  • Register
  •  View Cart (0)
  •  Customer Login
  • Register
  •  View Cart (0)

Takara Bio
  • Products
  • Services & Support
  • Learning centers
  • APPLICATIONS
  • About
  • Contact Us

Clontech Takara Cellartis

Close

  • ‹ Back to Bioinformatics resources
  • Automation systems
  • Next-generation sequencing
    • Product line overview
    • RNA-seq
    • Technical notes
    • Technology and application overviews
    • FAQs and tips
    • DNA-seq protocols
    • Bioinformatics resources
    • Webinars
    • Posters
  • Spatial biology
  • mRNA and cDNA synthesis
  • Gene function
  • Stem cell research
  • Protein research
  • PCR
  • Cloning
  • Nucleic acid purification
  • Antibodies and ELISA
  • Real-time PCR
CogentDS resource portal CogentDS product docs & additional resources
CogentDS software page Cogent NGS Discovery Software
Home › Learning centers › Next-generation sequencing › Bioinformatics resources › Cogent NGS Discovery Software v1.0 User Manual

Learning centers

  • Automation systems
    • Shasta Single Cell System introduction
      • Biomarker and drug discovery
      • Shasta educational library
    • SmartChip Real-Time PCR System introduction
      • SmartChip Real-Time PCR System applications
        • Pathogen detection in human samples and food
          • Pathogen detection from UTI, STI and wound infections
          • High-throughput detection of SARS-CoV-2
        • Antibiotic resistance genes
          • Screening for antibiotic resistance genes in manure and sewage
          • Uncovering antibiotic resistance genes in soil, sediment, and sludge
          • Tracking down antibiotic resistance genes in hospitals
          • Identifying antibiotic resistance genes in water
        • mRNA, miRNA, and lncRNA as disease biomarkers
        • Genotyping using animal and blood samples
      • SmartChip Real-Time PCR System video resources
        • Webinar: Monitoring ARGs in environmental samples
        • Webinar: antibiotic resistance screening
        • SmartChip tutorials
    • ICELL8 introduction
      • ICELL8 cx applications
        • Archival nanowell sequencing
      • ICELL8 technology overview
      • ICELL8 cx technical specifications
      • ICELL8 technical specifications (original system)
      • ICELL8 system vs plate-seq
      • Webinars
        • Webinar: Leveraging single-cell transcriptomics and epigenomics for biomarker discovery
        • Advances in single-cell indexing registration
        • Single-Cell Workshop at 2020 NextGen Omics Series UK
        • The power of full-length scRNA-seq
        • Sign up: cardiomyocyte webinar
      • Technical notes
        • Enhancing biomarker discovery with SMART-Seq Pro kit and ICELL8 cx system
        • ICELL8 cx system target enrichment for fusions
        • ICELL8 cx system reagent formulation and dispense guidelines
        • Improved detection of gene fusions, SNPs, and alternative splicing
        • Full-length transcriptome analysis
        • High-throughput single-cell ATAC-seq
        • Protocol: High-throughput single-cell ATAC-Seq
        • Single-cell identification with CellSelect Software
        • Single-cell analysis elucidates cardiomyocyte differentiation from iPSCs
        • Combined TCR profiling and 5’ DE in single cells
        • Automated, high-throughput TCR profiling
      • Sample preparation protocols
        • Basic cell preparation for the ICELL8 cx system
        • Protocol: Nuclei isolation from mammalian cells
        • Protocol: Mouse cardiomyocyte preparation
        • Isolate cells of any size
      • Video resources
      • Citations
      • Posters
      • System & software notices
    • Apollo library prep system introduction
      • Automated VeriSeq library preparation for PGS
      • Apollo library prep system citations
      • SMART-Seq v4 chemistry for the Apollo system
      • Apollo library prep system overview
      • Apollo system technical specifications
      • In-tip bead separation on the Apollo system
  • Next-generation sequencing
    • Product line overview
    • RNA-seq
      • Automated library prep
      • Technologies and applications
        • SMART technology
        • Single-cell mRNA-seq
        • Total RNA-seq
        • SMART-Seq PLUS solutions
      • Technotes
        • Enabling long-read RNA sequencing from low-input samples
        • Singular for low input total RNA seq
        • All-in-one cDNA synthesis and library prep from single cells
        • Automation-friendly, all-in-one cDNA synthesis and library prep
        • All-in-one cDNA synthesis and library prep from ultra-low RNA inputs
        • 3' mRNA libraries from single cells (SMART-Seq v4 3' DE Kit)
        • Full-length mRNA-seq for target capture
        • Stranded libraries from single cells
        • Stranded libraries from picogram-input total RNA (v3)
        • Stranded libraries from 100 pg-100 ng total RNA
        • Stranded libraries from 100 ng - 1 ug total RNA
        • Stranded libraries from FFPE inputs (v2)
        • Nonstranded libraries from FFPE inputs
        • Singular and Takara Bio library prep
        • Full-length, single-cell, and ultra-low-input RNA-seq with UMIs
      • Webinars
        • Pushing the limits of sensitivity for single-cell applications
        • Capturing biological complexity by high-resolution single-cell genomics
        • Taking single-cell RNA-seq by STORM
        • STORM-seq Q&A
        • Neural multiomics Q&A
        • Liver metabolic function, dissecting one cell at a time
        • Pushing the limits Q&A
        • Total RNA sequencing of liquid biopsies
        • Liver metabolic function Q&A
        • Automating full-length single-cell RNA-seq libraries
        • Single-cell whole transcriptome analysis
        • Sensitivity and scale for neuron multiomics
      • RNA-seq tips
      • RNA-seq FAQs
    • Technical notes
      • DNA-seq
        • Next-gen WGA method for CNV and SNV detection from single cells
        • Low-input whole-exome sequencing
        • DNA-seq from FFPE samples
        • Low cell number ChIP-seq using ThruPLEX DNA-Seq
        • Detection of low-frequency variants using ThruPLEX Tag-Seq FLEX
        • ThruPLEX FLEX outperforms NEBNext Ultra II
        • Streamlined DNA-seq from challenging samples
        • High-resolution CNV detection using PicoPLEX Gold DNA-Seq
        • ThruPLEX FLEX data sheet
        • Low-volume DNA shearing for ThruPLEX library prep
        • NGS library prep with enzymatic fragmentation
        • Comparing ThruPLEX FLEX EF to Kapa and NEBNext
      • Immune Profiling
        • Get started with BCR/TCR profiling
        • Track B-cell changes in your mouse model
        • Efficient and sensitive profiling of human B-cell receptor repertoire
        • TCRv2 kit validated for rhesus macaque samples
        • Improved TCR repertoire profiling from mouse samples (bulk)
        • TCR repertoire profiling from mouse samples (bulk)
        • BCR repertoire profiling from mouse samples (bulk)
        • Improved TCR repertoire profiling from human samples (bulk)
        • TCR repertoire profiling from human samples (single cells)
        • BCR repertoire profiling from human samples (bulk)
      • Epigenetic sequencing
        • ChIP-seq libraries for transcription factor analysis
        • ChIP-seq libraries from ssDNA
        • Full-length small RNA libraries
        • Methylated DNA-seq with MBD2
      • Reproductive health technologies
        • Embgenix ESM Screen
        • Embgenix PGT-A
    • Technology and application overviews
      • Embgenix GT-omics Oncology Tech Note
      • Sequencing depth for ThruPLEX Tag-seq
      • Whole genome amplification from single cells
    • FAQs and tips
      • Positive and negative controls in scRNA-seq
      • DNA-seq FAQs
      • ChIP-seq FAQs
      • Indexing FAQs
      • TCR-seq methods: Q&A
    • DNA-seq protocols
      • Using UMIs with ThruPLEX Tag-Seq FLEX
      • Targeted capture with Agilent SureSelectQXT
      • Exome capture with Illumina Nextera Rapid Capture
      • Targeted capture with Roche NimbleGen SeqCap EZ
      • Targeted capture with IDT xGen panels
      • Targeted capture with Agilent SureSelectXT
      • Targeted capture with Agilent SureSelectXT2
    • Bioinformatics resources
      • Cogent NGS Analysis Pipeline
        • Cogent NGS Analysis Pipeline notices
      • Cogent NGS Discovery Software
        • Cogent NGS Discovery Software notices
      • Cogent NGS Immune Profiler
        • Cogent NGS Immune Profiler Software notices
      • Cogent NGS Immune Viewer
      • Embgenix Analysis Software
      • SMART-Seq DE3 Demultiplexer
    • Webinars
      • Harnessing the power of full-length transcriptome analysis for biomarker discoveries
      • SMART-Seq Pro kits for biomarker detection
      • Takara Bio Single-Cell Workshop, Spring 2021
      • Single-Cell Workshop at 2020 NextGen Omics Series UK
      • Immunogenomics to accelerate immunotherapy
      • MeD-Seq, a novel method to detect DNA methylation
      • Single-cell DNA-seq
    • Posters
      • Long-read mRNA-seq poster
  • Spatial biology
  • mRNA and cDNA synthesis
    • mRNA synthesis
      • mRNA synthesis selection guide
      • mRNA synthesis FAQs
      • Takara IVTpro mRNA Synthesis System
        • Cloning Kit for mRNA Template
        • Takara IVTpro T7 mRNA Synthesis Kit
      • 5-prime capping of mRNA
        • Post-transcriptional capping
        • Co-transcriptional capping
      • Download resources
        • Sign up to download our infographic
      • Webinar: Streamlining your IVT workflow to maximize mRNA yields
    • cDNA synthesis
      • Premium total and poly A+ RNA
      • SMARTer RACE 5'/3' Kit
      • Cloning antibody variable regions
  • Gene function
    • Gene editing
      • Gene editing product finder
      • Gene editing tools and information
        • sgRNA design tools
        • Tools for successful CRISPR/Cas9 genome editing
        • Gene editing posters
        • Customer data for Guide-it products
        • How to design sgRNA sequences
        • Introduction to the CRISPR/Cas9 system
        • Gene editing of CD3+ T cells and CD34+ HSCs
      • CRISPR/Cas9 knockouts
        • Mutation detection kit comparison
        • Screening for effective guide RNAs
        • Monoallelic versus biallelic mutants
        • Indel identification kit for mutation characterization
      • CRISPR/Cas9 knockins
        • Choosing an HDR template format
        • Homology-directed repair FAQs
        • Mouse CRISPR knockin protocol
        • Site-specific gene knockins using long ssDNA
        • Efficient CRISPR/Cas9-mediated knockins in iPS cells
        • Oligo design tool for detecting precise insertions
          • Oligo design tool user guide (insertions)
      • Genome-wide screening
        • CRISPR library screening
        • CRISPR library screening webinar
        • Phenotypic screen using sgRNA library system
      • Creating and screening for SNPs
        • SNP detection with knockin screening kit
        • Oligo design tool for SNP screening
          • Oligo design tool user guide (SNPs)
        • Sign up: SNP engineering webinar
        • Guide-it SNP Screening Kit FAQs
      • CRISPR/Cas9 delivery methods
        • Electroporation-grade Cas9 for editing in diverse cell types
        • CRISPR/Cas9 gene editing with AAV
        • CRISPR/Cas9 gesicles overview
        • Cas9 Gesicles—reduced off-target effects
        • sgRNA-Cas9 delivery to many cell types
        • Tet-inducible Cas9 for gene editing
      • Cre recombinase
        • Control your Cre recombinase experiments
        • Fast Cre delivery with gesicle technology
    • Viral transduction
      • Recombinant virus comparison
      • Product finder
      • Transduction posters
      • Lentivirus
        • Lenti-X Transduction Sponge overview
          • Lenti-X Transduction Sponge tech note
          • Lenti-X Transduction Sponge compatible cell types
        • Webinars
          • Webinar: Cellular reprogramming of cancer cells for immunotherapy
          • Lentiviral particles webinar
        • Customizable SARS-CoV-2 pseudovirus
        • Lenti-X FAQs
        • Lentiviral workflow
        • Lentiviral products guide
        • Lentivirus biosafety
        • Lentiviral tips
        • Lentiviral vectors
        • Lenti-X packaging
        • High-throughput lentivirus production
        • Lenti-X Concentrator
        • Lentiviral titration
        • Lenti-X GoStix Plus video protocols
        • Lenti-X GoStix Plus FAQs
        • Rapid lentivirus titration by p24 ELISA
        • Lentiviral particles
        • Lentiviral particles—fluorescent
        • Lentiviral particles FAQs
      • Retrovirus
        • Retroviral products
        • Retro-X FAQs
        • Retro-X packaging
        • Retro-X Concentrator
      • Adeno-associated virus
        • AAV workflow
        • AAV products
        • AAV FAQs
        • AAV tech notes
          • Customer data: Purified AAV9 delivery (mouse brain)
          • Customer data: Purified AAV9 delivery (songbird brain)
          • Serotype-independent AAV vector purification
          • Customer data: Purified AAV2 delivery (mouse brain)
        • AAV videos
          • AAV2 purification video
          • AAVpro "All Serotypes" protocols
        • AAVpro Concentrator overview
      • Adenovirus
        • Adenoviral FAQs
        • Adenoviral products
        • Fastest, easiest adenoviral system ever
        • Tet-inducible adenovirus
        • Adenovirus purification kits
        • Adenovirus purification mega-scale
        • Adenovirus rapid titer
        • Adenoviral titration
    • T-cell transduction and culture
      • Technology overview
      • Adoptive T-cell therapy (ACT)
      • RetroNectin FAQs
      • Hematopoietic cell transduction
      • T-cell expansion
      • Serum-free T-cell culture
      • CultiLife culture bags protocol
      • Cytokine analysis
    • Inducible systems
      • iDimerize systems
        • Inducible protein-protein interactions—iDimerize systems
        • iDimerize systems journal club
        • iDimerize in vivo protocol
        • iDimerize systems citations
        • ARGENT cell signaling regulation kits from ARIAD
      • ProteoTuner systems
        • ProteoTuner technology overview
        • ProteoTuner citations
        • Inducible protein stabilization systems product selection guide
      • Tet-inducible systems
        • Tet systems product selection guide
        • Tet systems overview
        • Tet-One technology overview
        • Tet-On 3G plasmid system kit components
        • Tet-On 3G lentiviral system kit components
        • Tet system webinars
    • Transfection reagents
      • Xfect Transfection Reagent
      • Transfection tips
      • Cell lines transfected with the Xfect reagent
      • Protein transfection FAQs
      • Xfect RNA Transfection Reagent
      • Transfection reagent products
      • Protocol: transfection of cerebellar slice cultures with Xfect reagent
      • Calcium phosphate transfection of neurons
    • Fluorescent proteins
      • Fluorescent protein vector finder
      • Fluorescent protein excitation and emission maxima
      • Fluorescent protein antibodies selection guide
      • Fluorescent protein antibody citations
        • GFP antibody citations
        • RFP antibody citations
      • Fluorescent protein quick guide
      • Fluorescent retroviral expression vectors
      • Verify miRNA expression
      • Find EGFP vector alternatives
    • Cell biology assays
      • Technical notes
        • Cell viability and proliferation measurement
      • Citations
  • Stem cell research
    • Overview
      • Stem cell research products
      • Stem cell media products
      • Hepatocyte products
      • iPS cell to hepatocyte differentiation overview
    • Protocols
      • Hepatocytes
        • Video protocols for hiPS-HEP v2 cells
        • Getting started with hepatocyte differentiation
      • Pluripotent stem cells
        • Single-cell cloning with DEF-CS 500 Culture System
        • Transferring iPSCs on MEFs to DEF-CS
        • Transferring iPSCs from other media to DEF-CS
        • Spin embryoid body formation
        • Reprogramming PBMCs
        • Reprogramming fibroblasts
      • Cardiomyocytes
        • Cardiomyocytes in FLIPR 384-well plate format
        • Cardiomyocytes on the Patchliner system
        • Cardiomyocytes on the Maestro MEA system
        • Cardiomyocytes on the MED64 MEA system
        • Cardiomyocytes on the CardioExcyte 96 system
        • Cardiomyocytes on the xCELLigence RTCA CardioECR system
    • Applications
    • Technical notes
      • Pluripotent stem cells
        • Using the DEF-CS system to culture human iPS cells
        • Comparison of the Cellartis DEF-CS system with other vendors' human iPS cell culture systems
        • Reprogramming PBMCs
        • Reprogramming fibroblasts
      • Gene editing in hiPS cells
        • Tagging an endogenous gene with AcGFP1 in hiPS cells
        • Tagging an endogenous gene with a myc tag in hiPS cells
        • Generating clonal hiPS cell lines deficient in CD81
        • Introducing a tyrosinemia-related SNP in hiPS cells
        • Inserting an expression cassette into the AAVS1 locus in hiPS cells
        • Editing hiPS cells using electroporation
        • Editing hiPS cells using gesicle technology
        • Single-cell cloning of hiPS cells
      • Organoids
        • Retinal organoid differentiation from iPSCs cultured in the Cellartis DEF-CS 500 Culture System
        • Liver organoid differentiation from iPSCs for prediction of drug-induced liver injury
        • Generation of embryonic organoids using NDiff 227 neural differentiation medium
      • Beta cells
        • Beta cells for disease modeling
      • Hepatocytes
        • hiPS-HEP cells for disease modeling
        • hiPS-HEP cells for drug metabolism studies
        • Power medium for long-term human primary hepatocyte culture
        • iPS cell to hepatocyte differentiation system
      • Cardiomyocytes
        • Making engineered heart tissue with cardiomyocytes
      • Neural stem cells
        • RHB-A neural stem cell medium
    • Posters
    • Webinars
      • Using hiPS gene editing to create a tyrosinemia disease model
    • Videos
      • Hepatocyte offerings
    • FAQs
      • Cellartis DEF-CS 500 Culture System FAQs
      • Cellartis enhanced hiPS-HEP FAQs
      • Cellartis iPS Cell to Hepatocyte Differentiation System FAQs
    • Citations
      • Cellartis MSC Xeno-Free Culture Medium
      • Cellartis Power Primary HEP Medium
      • Cellartis DEF-CS 500 Culture System
      • Cellartis Enhanced hiPS-HEP cells
      • Cellartis hPS cell-derived cardiomyocytes
      • Cellartis iPS Cell to Hepatocyte Differentiation System
      • GS1-R
      • 2i mES/iPSC medium
      • iMatrix-511
      • 3i mES/iPSC medium
      • NDiff 227
      • NDiff N2
      • RHB-A
      • STEM101
      • STEM121
      • STEM123
    • Selection guides
      • Stem cell antibody selection guide
      • Stem cell media product finder
      • Stem cell tools product finder
      • Hepatocyte product finder
  • Protein research
    • Capturem technology
      • Capturem protocols
      • Capturem tech notes and applications
      • FAQs about Capturem technology
      • Capturem technology citations
      • Capturem posters
    • Antibody immunoprecipitation
      • IP and Co-IP of cardiac voltage-gated ion channel proteins
      • Tech note: thiophilic antibody purification resins
      • Tech note: IP and Co-IP
    • His-tag purification
      • Purification methods overview
      • TALON resin selection guide
      • Selection guide: His60 resin
      • xTractor Buffer is optimized for superior protein yield
      • Why tag a protein?
      • Tech note: cobalt resin
      • Simplified purification of active, secreted his-tagged proteins
      • Overview: His60
      • Tech note: Capturem technology
      • Tech note: Capturem large volume
      • Magnetic beads
      • FAQs: TALON
      • Protocols
        • Video: Capturem his maxiprep
        • Video: Capturem his miniprep
        • Visual protocol: Capturem his maxiprep
        • Visual protocol: Capturem his miniprep
        • Capturem nickel column reagent compatibility
        • TALON reagent compatibility
        • His60 reagent compatibility
        • TALON: Native vs denaturing purification
        • Protocol: denaturing purification with TALON resin, imidazole elution
        • Protocol: native purification with TALON resin, imidazole elution
        • Protocol: native purification with TALON resin, pH elution
    • Other tag purification
      • Streptavidin-based enrichment using Capturem technology
      • Selection guide: peptide tags
      • Myc-tagged protein purification overview
      • GST-tagged protein purification overview
    • Phosphoprotein and glycoprotein purification
      • Non-tagged protein purification overview
      • Phosphoprotein purification overview
    • Matchmaker Gold yeast two-hybrid systems
      • Matchmaker Gold Yeast Two-Hybrid System
      • Make your own library for yeast two-hybrid screening
      • Mate and Plate yeast two-hybrid cDNA libraries
      • Aureobasidin A for improved selectable drug resistance in yeast
    • Expression systems
      • Protein expression overview
      • Insect expression overview
      • Mammalian expression overview
      • pHEK293 Ultra expression overview
      • OKT3 expression in mammalian cells
      • Bacterial expression overview
  • PCR
    • Citations
      • PrimeSTAR HS
      • EmeraldAmp MAX
      • Terra PCR Direct
      • EmeraldAmp GT
      • Takara Ex Taq
      • PrimeSTAR Max
      • PrimeSTAR GXL
      • Takara LA Taq
      • SpeedSTAR HS
      • Takara Taq and Taq HS
      • Titanium Taq
    • PCR selection guide
    • PCR enzyme brochure
    • Technical notes
      • Rapid, high-performance multiplex PCR
      • EmeraldAmp outperforms MyTaq Red mix
      • Fast and accurate PCR
      • Methylation studies
      • Hot-start PCR
      • Long-range PCR with LA Taq
      • Direct PCR from human nail
      • Direct PCR from meat samples
      • Megaprimer PCR with PrimeSTAR GXL
      • Amplifying GC-rich templates
      • Titanium Taq for high-throughput genotyping
      • Colony PCR in under an hour
      • High-throughput endpoint PCR
      • Direct PCR from blood
      • PrimeSTAR GXL for targeted sequencing
      • Detecting somatic mosaicism using massively parallel sequencing
    • FAQ
      • Primer design
      • Optimization
      • Troubleshooting
      • Applications and conditions
      • Shipping, storage, and handling
    • Go green with lyophilized enzymes
  • Cloning
    • Automated In-Fusion Cloning
    • In-Fusion Cloning general information
      • In-Fusion Cloning overview
      • In-Fusion Cloning guide
      • In-Fusion Cloning and competition
        • In-Fusion Snap Assembly vs. GeneArt Gibson Assembly HiFi
        • In-Fusion Snap Assembly vs. NEBuilder HiFi
        • Sequence accuracy in seamless cloning
        • Choosing a seamless cloning method
        • Improving background over Gibson Assembly
        • A successful alternative to ligation cloning
        • Single- and multiple-insert cloning
        • Easy cloning into lentiviral vectors
        • Outperforming TOPO cloning
      • In-Fusion Cloning citations
      • Stellar Competent Cells product overview and performance data
      • EcoDry reagents and sustainability
    • Primer design and other tools
      • Seamless cloning primer design
      • In-Fusion Cloning tutorials
        • Cloning one or more fragments
        • Deleting a sequence
        • Inserting a sequence
        • Deleting and replacing a sequence
      • In-Fusion molar ratio calculator
      • Simulate your construct
    • In‑Fusion Cloning tips and FAQs
    • Applications and technical notes
      • In-Fusion Cloning applications collection
      • Efficient multiple-fragment cloning
      • Mutagenesis with In-Fusion Cloning
      • Rapid, high-throughput cloning for antibody development
      • Solve a synthesis challenge with easy multiple-insert cloning
      • Direct cloning into large vectors
      • Simplified insertion of a GFP-encoding cassette into a 100-kb plasmid
      • Efficient cloning for sgRNA/Cas9 plasmids
      • In-Fusion Cloning of sgRNAs
      • De novo insertion of small fusion protein tags
    • Sign up to stay updated
    • Traditional molecular cloning
      • Restriction enzyme overview
        • General information about restriction enzymes
        • Star activity of restriction enzymes
        • Inactivation of restriction enzymes
        • Buffer activity with restriction enzymes
        • Universal buffers for double digestion with restriction enzymes
        • Restriction enzymes affected by methylation
        • Methylation-sensitive restriction enzymes
        • QC of restriction enzymes
      • Ligation cloning overview
      • Ligation product guide
    • In-Fusion Cloning webinars
  • Nucleic acid purification
    • Nucleic acid extraction webinars
    • Product demonstration videos
    • Product finder
    • Plasmid kit selection guide
    • Plasmid purification
      • NucleoSpin Plasmid Transfection-grade
      • NucleoSnap Plasmid Midi
      • NucleoBond Xtra Midi/Maxi
      • EF plasmid purification overview
    • Genomic DNA purification
      • Tissue
        • NucleoSpin Tissue
        • NucleoSpin DNA RapidLyse
        • NucleoSpin Tissue XS
        • NucleoMag DNA Swab
        • NucleoBond HMW DNA
        • NucleoSpin DNA Lipid Tissue
      • FFPE
        • NucleoMag DNA FFPE
        • NucleoSpin 96 DNA FFPE
      • Blood and plasma
        • NucleoMag Blood
        • NucleoSnap cfDNA
        • NucleoSpin cfDNA XS
        • NucleoMag cfDNA
        • NucleoSpin cfDNA Midi
      • Plant
        • NucleoMag 384 Plant
        • NucleoSpin Plant II
      • Other organisms and samples
        • NucleoMag DNA Bacteria
        • NucleoMag DNA Food
        • NucleoSpin DNA Insect
        • NucleoSpin Microbial DNA
    • DNA/RNA cleanup and extraction
      • NucleoSpin Gel and PCR XS product overview
      • NucleoSpin Gel and PCR Clean-up
      • NucleoMag NGS Clean-up and Size Select
      • NucleoSpin RNA Clean-up
    • RNA purification
      • RNA purification overview
      • NucleoSpin RNA Plus
      • NucleoSpin RNA Plus XS
      • NucleoSpin RNA
      • NucleoProtect RNA
      • NucleoSpin miRNA
      • NucleoSpin RNA Blood
      • NucleoSpin miRNA Plasma
      • NucleoZOL for RNA isolation
      • High-throughput RNA isolation from FFPE samples
      • NucleoSpin RNA Plant and Fungi
    • RNA purification kit finder
    • Viral DNA and RNA purification
      • Nucleic acid detection from wastewater
      • NucleoSpin VET
      • NucleoMag VET
      • NucleoMag Virus
      • NucleoMag Pathogen
    • Parallel DNA, RNA & protein
      • NucleoSpin RNA/Protein
      • NucleoSpin TriPrep
    • Automated DNA and RNA purification
      • Application notes, by sample type
        • Plasmid purification
        • DNA cleanup
        • DNA from cells and tissues
        • RNA from cells and tissues
        • DNA from blood and bodily fluids
        • DNA and RNA from plants, fungi, and food
        • Viral RNA and DNA purification
      • Application notes, by platform
        • Eppendorf
        • Tecan
        • Hamilton
        • Thermo Fisher Scientific
        • MASMEC Biomed
    • Accessory selection guides
      • Sample homogenization beads
      • NucleoBond racks selection guide
    • Microbiome
      • NucleoMag DNA Microbiome
      • NucleoSpin Soil
      • NucleoSpin 8/96 Soil
      • NucleoSpin DNA Stool
      • NucleoSpin 96 DNA Stool
      • NucleoMag DNA/RNA Water
      • NucleoSpin eDNA Water
      • NucleoBond RNA Soil
      • NucleoSpin RNA Stool
  • Antibodies and ELISA
    • Osteocalcin focus
  • Real-time PCR
    • Download qPCR resources
      • Download our mycoplasma white paper
      • Download our mycoplasma infographic
    • Overview
      • One-step RT-qPCR kits
      • Two-step RT-qPCR kits
      • Probe-based qPCR kits
      • TB Green-based qPCR kits
      • Videos: qPCR analysis for challenging inputs
      • qRT-PCR to detect RNA present at low levels
    • Product finder
    • Reaction size guidelines
    • Real-time PCR products brochure
    • Real-time PCR tutorial videos
    • Guest webinar: extraction-free SARS-CoV-2 detection
    • Technical notes
      • Unbiased preamplification of limited samples
      • Accurate gene expression analysis with TB Green Premix Ex Taq II
      • Efficient quantification of human gene expression with PrimeScript Reverse Transcriptase
      • Rapid qPCR analysis from blood samples using PrimeScript Reverse Transcriptase
      • Monitoring siRNA knockdown
      • qPCR without optimization using TB Green Premix Ex Taq
      • Fast synthesis of cDNA templates for real-time RT-PCR
      • Specific, consistent real-time PCR with TB Green Premix Ex Taq II
      • Mir-X microRNA quantification
    • FAQs
New products
Need help?
Contact Sales
CogentDS resource portal CogentDS product docs & additional resources
CogentDS software page Cogent NGS Discovery Software

Cogent NGS Discovery Software v1.0 User Manual

(Last updated: 01-Oct-2020)

Cogent NGS Discovery Software (referred to as CogentDS in this manual) is bioinformatics software for user-friendly analysis of sequencing data derived from Takara Bio applications, such as the ICELL8 cx Single-Cell system and the ICELL8 Single-Cell system workflows.

I. Before you begin

A. Supported operating systems

The CogentDS is designed to be installed on a user workstation and should work on any system that supports R (see Section I.D). Installation and functionality have been tested and supported for the following OSs:

  • Windows 7, Windows 10
  • macOS Sierra (10.12) or higher
  • Linux CentOS 6.9 or higher

B. Hardware requirements

CogentDS with its dependencies is a lightweight program. It should work on any basic workstation (desktop or laptop) with >2 GB of free disk space and a minimum of 8 GB RAM.

C. User account requirements

By default, administrative privileges are not required to install or run CogentDS. However, if working in an environment where R is installed with IT restrictions, an administrator may need to install the necessary software dependencies (Section I.D) and the Cogent NGS Discovery Software.

D. Additional hardware and software dependencies and recommendations

  • Internet connectivity on the computer/server
  • R

    R is a free, open-source software for statistical computing that provides support across a variety of operating systems. CogentDS is designed to work within an R environment. More information on obtaining and installing R is available in Section III.A.

  • RStudio (IDE for R)

    RStudio is a free, open-source program that provides graphical user interface (GUI) access to R. More information on obtaining and installing RStudio is available in Section III.C.

  • devtools

    devtools is a free, open-source R tool that enhances the development and installation of R packages; it's used to install Cogent NGS Discovery Software. More information on obtaining and installing RStudio devtools is available in Section III.D.

  • An open network port on the install machine

    As the CogentDS interface is accessed through a web GUI, a network port needs to be available on the computer it will be installed on. The port number is selected at random by the Rstudio package, shiny, checking for open ports on the install computer or server until an one is found. For more information about this assignment process, please see https://shiny.rstudio.com/reference/shiny/1.0.1/runApp.html.

    If running in an environment where the TCP/IP ports are locked down, please check with your local IT to ensure a port is available on the computer for CogentDS to use.

  • Pandoc (optional)

    Pandoc is another R utility that is installed natively with RStudio Desktop. For advanced users that wish to forgo RStudio and run R from the command line, the Pandoc Software Package must be downloaded, installed, and placed in the PATH.

E. Required input files

CogentDS requires one of the two following file options as input. The listed files are output from Cogent NGS Analysis Pipeline v1.0 (CogentAP):

  • CogentDS.analysis.rda, an R-object file. The advantage to this input is that the quality control, clustering, and differential expression modules have been pre-calculated, resulting in faster upload speeds.
  • Raw gene-count matrix and stats/metadata files. These allow the user to interactively run the data through quality control filtering, clustering, and differential expression. More information on this process can be found in Section IV.D.

II. Software overview

Figure 1

Figure 1. High-level analysis workflow of Cogent NGS Analysis Pipeline (CogentAP) and Cogent NGS Discovery Software (CogentDS).

Figure 1 depicts the high-level workflow of the analysis provided by CogentAP and how its output can be carried over to CogentDS. For more information about Cogent NGS Analysis Pipeline, see the Cogent NGS Analysis Pipeline v1.0 User Manual.

Once CogentDS and required dependencies are installed, analysis can be launched in an interactive RStudio session.

III. Installation and configuration requirements

To obtain Cogent NGS Discovery Software, please visit the ICELL8 software portal at takarabio.com/ICELL8-software.

A. Install R

R and many of the contributed packages are available on the Comprehensive R Archive Network (CRAN). If R is not installed on your system, please download and install R version 3.6.0 or higher from https://www.r-project.org, by first choosing a CRAN mirror of your choice.

For more information on installing R, see the tutorial at datacamp.com.

B. Install platform-specific tools

Installation of CogentDS on Windows or Macintosh workstations requires additional third-party software be installed prior to installing RStudio.

  1. Windows

    On Windows, R requires Rtools to build and install packages from a source file. Download Rtools from https://cran.r-project.org/bin/windows/Rtools/history.html. During installation, ensure that Rtools is included in the system PATH.

    For a more information on installing Rtools, see the instructions at rdocumentation.org.

    NOTE: Rtools must be installed in a file path with directory names which do not include spaces. (i.e., it cannot be installed in C:\Program Files\ but could be installed in C:\Program\). Installing it in a file path with spaces in the directory names will cause the Cogent NGS Discovery Software installation to fail.

    If Rtools is installed in such a location on the target computer, please uninstall Rtools and re-install in a folder with a path that conforms to these requirements.

  2. macOS

    R version 3.6.x requires clang-7.0.0.pkg. This can be downloaded from https://cran.r-project.org/bin/macosx/tools/.

C. Install RStudio

If RStudio is not installed on your system, please download and install the RStudio Desktop (Open Source License) version for your Operating System from rstudio.com.

Figure 2

Figure 2. rstudio.com screenshot of the package to download.

For more information on installing RStudio on Windows, refer to the same tutorial at datacamp.org as in Section III.A for installing R (scroll down towards the bottom of that page).

D. Install devtools

CogentDS requires devtools version 2.1.0 or higher be installed on the computer prior to its installation. Refer to https://cran.r-project.org/web/packages/devtools/readme/README.html.

  1. If devtools is already installed on the computer, verify that the version is 2.1.0 or later by running the following command from the Console prompt of RStudio:

    packageVersion("devtools")

    Figure 3

    Figure 3. Example devtools version check in RStudio.

  2. To update the devtools version or for a new install, enter the following command into the Console window of RStudio:

    install.packages("devtools")

E. (Optional) Install Pandoc

Instructions for downloading and installing Pandoc can be found at pandoc.org.

F. Install Cogent NGS Discovery Software

Once the prerequisites are installed, CogentDS can be installed with the following command:

devtools::install_github("takarabiousa/CogentDS", auth_token = "<AUTHCODE>")

where <AUTHCODE> will be a unique authorization token provided via email (see details below).

Figure 4A
Figure 4b

Figure 4. Example of the text displayed when the Cogent NGS Discovery Software installation starts.

To obtain the authorization token, please register at the Cogent NGS Discovery Software page at takarabio.com/ICELL8-software.

For first-time users, the installation process may take 10–20 minutes, as many dependencies are automatically downloaded and installed. The installation may also prompt the user to accept downloading and installing certain packages from the source. Answer yes to any such prompts.

G. Upgrading Cogent NGS Discovery Software

The procedure to upgrade CogentDS is to the same as the procedure for doing an installation (Section III.F, above).

It may be that during the upgrade, the script will notice updates to the R dependencies installed along with CogentDS. If that occurs, it is recommended to select whatever the 'All' value is (1 in the Figure 5 example, below).

Figure 5

Figure 5. Example of CogentDS upgrade process detecting newer R dependency packages.

If an error is thrown indicating Rstudio could not remove a prior package installation, please refer to the Cogent NGS Discovery Software notices for one potential fix.

H. Uninstalling Cogent NGS Discovery Software

To uninstall Cogent NGS Discovery Software, run the following command at the Rstudio prompt:

remove.packages("CogentDS")

IV. Launching Cogent NGS Discovery Software

A. Getting started

Once installation is complete, CogentDS can be launched with the following command in an open RStudio session:

CogentDS::launch()

Entering this command will launch the default browser on your computer and create a new instance of the CogentDS user interface (GUI), running through the localhost of your computer (IP address 127.0.0.1) and a randomly assigned, available TCP/IP port (see Section I.D, for more information about the selection of the TCP/IP port).

Figure 6

Figure 6. Initial screen of CogentDS in the web browser.

B. Upload data

Click [Get Started] to start the process. The Select Input Data window will pop up. Choose the input data type from the dropdown menu, which displays 'CogentDS file' by default.

Figure 7a        

Figure 7. The Select Input Data browser pop-up window. Default view upon launch and dropdown menu for input options.

NOTE: The Select Input Data menu can also be accessed with the [Upload New Dataset] button from the File Management menu in an established CogentDS session. See Figure 51 in Section IV.F for where to locate the button.

The Select Input Data window allows the user to enter data in one of two ways:

  1. Through a CogentDS.analysis.rda file, an R object file, which is output from CogentAP.

    Figure 8

    Figure 8. R object file included in the example data in CogentDS.

  2. Through raw gene matrix and stats/metadata files, also output from CogentAP. Refer to Section IV.C for more information about these files.

    Figure 9

    Figure 9. Data CSV files included in the example data of CogentDS.

    The primary difference between the two options is that the CogentDS R file has already been run through the quality control, clustering, and differential expression modules in the Cogent NGS Analysis Pipeline, thus allowing quick visualization of the data.

    If a CogentDS R file (Figure 10) is entered, skip to Section IV.E (Discover).

    Figure 10a   Figure 10b

    Figure 10. Selecting the example Cogent NGS Analysis Pipeline output CogentDS file or CSV gene matrix and metadata files for input.

    Entering the gene matrix and stats files allows the user to exercise more control over parameters by interactively running the data through quality control filtering, clustering, and differential expression analysis described in the rest of this section.

    Once the input data source is selected, hit [Submit] to continue.

    NOTE: The Example Data link in Figures 11 and 15 downloads data from the study "Massively parallel nanowell-based single-cell gene expression profiling" (Goldstein et al. 2017).

    The screenshots in the rest of this section are based on that sample data.

    Figure 11

    Figure 11. Download prompt for the sample Goldstein et al. 2017 sample data, from the Example Data link of the CogentDS UI.

C. Format of the gene-count matrix and stats/metadata files

  1. Gene matrix file

    The gene matrix file (sometimes called the gene table or counts matrix) must be in comma-separated values (CSV) format containing columns of unique sample identifiers, with rows of gene names. Each entry in the matrix is an expression value representing the expression of a gene (i) for a sample (j). The expression data should be raw count data.

    If imported from CogentAP, the file will be called analysis_genematrix.csv (from the GUI) or analyze_genematrix.csv or analyze_umi_genematrix.csv (from the command-line interface [CLI]). In Figure 9, it is the zipped genematrix.csv.

    NOTE: For optimal performance, compress (.zip) the gene matrix file before uploading.

    Figure 12

    Figure 12. Example of a gene matrix file.

  2. Stats file

    The stats file must be in CSV format with one column containing the unique sample identifiers used in the gene-count matrix and any number of subsequent columns with metadata for each sample (i.e., cell type, gene counts, read depth, mitochondrial %, etc.).

    If imported from CogentAP, the file will be called analysis_stats.csv (from the GUI) or analyze_stats.csv (from the CLI). In Figure 9, it is metadata.csv.

    The full list of possible columns in this file accepted by CogentDS is described in the Appendix.

    Figure 13

    Figure 13. Example Stats file output.

D. Run Quality Control and Clustering modules on raw datasets

Entering the raw gene-count matrix and stats/metadata files prompts the user to enter options for the Quality Control module.

  1. The first screen is for QC filter options. Select how to filter non-informative cells and genes from the gene-count matrix. Click the [Next: Norm/Log] button when finished.

    Figure 14

    Figure 14. Default Quality Control menu for QC filter options.

  2. The next screen is for normalization and transformation options.

    Figure 15

    Figure 15. Default Quality Control menu, for normalization and transformation options.

    1. "Normalize gene matrix?"

      The available normalization methods include Counts Per Million (CPM), Transcripts Per Kilobase Million (TPM), and Reads Per Kilobase Million (RPKM).

      Figure 16

      Figure 16. Expanded "Normalization method" drop-down menu.

      To normalize by 'median cell coverage', select 'CPM' from the "Normalization method" drop-down menu and type 'median' into the "Normalization factor" input box (Figure 17).

      Figure 17

      Figure 17. Parameters to normalize by median cell coverage.

    2. "Log transform gene matrix?"

      To log transform the data, the available options are natural log, Base 2, and Base 10.

      Figure 18

      Figure 18. Expanded "Log base" drop-down menu.

  3. When all desired parameters are populated, click [Next: Clustering].

  4. A window will pop up prompting you to enter options for the Cluster Analysis module. By default, CogentDS performs clustering analysis based on the 2,000 most variable genes. These genes are used as input for a Principal Component Analysis, and the top Principal Components are selected for further reduction and visualization using either the Uniform Manifold Approximation and Projection (UMAP, recommended) or t-Distributed Stochastic Neighbor Embedding (t-SNE) method.

    Figure 19

    Figure 19. Cluster Analysis menu.

  5. Input your parameters and click [Launch Analysis]. Data transformation will begin, and a status pop-up similar to those in Figure 20 will display on the bottom right-hand corner of the browser window.

    Figure 20   Figure 20b

    Figure 20. Two of the stages of the status pop-up while the cluster analysis is running.

  6. After running the cluster analysis, the plot will be rendered in the center of the window, with menus in the right and left sidebars, plus a QC table below the plot.

E. Discover

The baseline plot displays the results of graph-based clustering; however, this can be modified with the User Controls and Formatting menu options in the sidebar panel to the left of the screen.

Figure 21

Figure 21. Baseline UMAP analysis plot.

  1. User Controls

    1. To highlight cells by cell type, go to the User Controls accordion menu in the left sidebar and select an option from the "Select Group(s)" drop-down box. This field is pre-populated with all column headers from the metadata file. Selecting different metadata features allows the user to highlight the cells by any desired method.

      Figure 22a  Figure 22b

      Figure 22. Example "Select Group(s)" drop-down menu and the resulting UMAP analysis plot with cells highlighted by cell sample type.

    2. Another method to highlight cells is by expression levels for genes. Entering one or multiple genes into the "Select Gene(s)" field plots the average expression across the panel for each cell and renders the expression into the plot. In Figure 23, the plot highlights ENSG00000261857, a single marker for the A375 cell type.

      Figure 23a   Figure 23b

      Figure 23. Example "Select Gene(s)""drop-down menu and the resulting UMAP analysis plot with cells highlighted for gene ENSG00000261857.

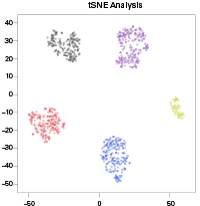
    3. If the user chooses the t-SNE method, the "Perplexity" parameter can also be configured from within the Clustering menu in the right sidebar (see Figure 24). A feature of the t-SNE calculation that broadly serves as an estimate of the cluster size(s) within the data, high perplexity parameters will define large, global structures within the dataset, while smaller perplexities will identify small, local structures.

      NOTE: Perplexity defaults have been optimized for general-use cases of the ICELL8 cx Single-Cell and ICELL8 Single-Cell Systems. These values are different from the standard defaults in the Rtsne package and may need to be reoptimized for unique applications.

      For more information, please refer to https://github.com/jkrijthe/Rtsne, https://distill.pub/2016/misread-tsne, and https://cran.r-project.org/web/packages/Rtsne/Rtsne.pdf.

      Figure 24a
      Figure 24b

      Figure 24. t-SNE analysis plot with cells clustered by high perplexity (100, top) and low perplexity (5, bottom).

  2. Formatting

    In the Formatting tab in the left sidebar panel, the marker size and transparency can be changed. These can be used to visualize the data to the user's preferences but are also useful for identifying individual cells within larger clusters.

    Figure 25a
    Figure 25b
    a.
    b.
    Figure 25c
    Figure 25d
    c.
    d.

    Figure 25. Illustration of different marker sizes and transparency selections in the Formatting menu applied to the same data plot. (Top) (a) larger and (b) smaller marker size. (Bottom) (c) less and (d) more transparency.

  3. Floating menu

    To the right of the chart, there is a menu of icons that only displays when hovered over with the mouse cursor.

    Figure 26

    Figure 26. Location of the floating menu icons to the right of the UMAP chart.

    1. Pan and Reset axes

      Figure 27a     Figure 27b

      Figure 27. Identification of the Pan and Reset axes icons in the floating menu.

      1. The [Pan] function can be used to move the scatter plot within the frame of the chart axes, changing not only which plots are visible, but also the range values on the X- and Y-axes.

        Figure 28

        Figure 28. Example after using the Pan function to move the plots down the page, increasing the values of the Y-axis compared to the default in Figure 26.

      2. [Reset axes] will return the plot to the default view (Figure 26) after using the [Pan], [Zoom in], and/or [Zoom out] functions.

    2. Zoom in and Zoom out

      Figure 29a     Figure 29b

      Figure 29. Identification of the Zoom in and Zoom out icons in the floating menu.

      The [Zoom in] and [Zoom out] buttons can be used to either enlarge or shrink the plots within the chart, decreasing or increasing the scale of the axes (respectively).

    3. Lasso Select

      Figure 30

      Figure 30. Identification of the Lasso Select icon in the floating menu.

      The [Lasso Select] feature can be used to select, group, and label cells in a custom manner.

      1. Click the [Lasso Select] icon.

      2. Click in the plot area and, while holding the mouse button down, use the mouse cursor to draw around the cells of interest. The line will automatically adjust its shape based on the movement of the mouse cursor.

        Figure 31

        Figure 31. Lassoing a cell cluster of interest.

      3. Stop pressing on the mouse button, and the Custom Selection window will pop up.

        Figure 32

        Figure 32. Default Custom Selection pop-up window.

        1. Enter label for selected cells: (Optional) Type in text that will identify the cluster in the legend on the right-hand side of the chart.

          Figure 33

          Figure 33. Typing in a custom label name for the lassoed cells on the chart.

        2. Select color: (Optional) Click on the color bar to expand out to a color selector gradient. Macro changes can be made on the vertical rainbow bar, while finer gradients can be selected by moving the dot around the larger square of color shades on the left.

          Figure 24a        Figure 34b

          Figure 34. Examples of two different color selections using the macro and finer gradients fields.

      4. Once the options are selected, hit the [Set custom label] button to apply them. To quit without applying the customization, press the [Dismiss] button.

      5. If the customizations are set, the Custom Selection pop-up will disappear, and the chart will reflect the changes made.

        Figure 35

        Figure 35. Illustrating the application of the customizations from iii.1, above.

      6. Repeat this process, if desired, for other clusters (as shown in the figure below). Or to reset back to the default, click the [Clear custom selections] button, located in the User Controls menu in the left sidebar.

        Figure 36a     Figure 36b

        Figure 36. Multiple custom labeled and tinted clusters and the [Clear custom selections] button.

  4. QC table

    The Quality Control table under the main figure provides data on QC-filtering and experimental overview statistics.

    Figure 37

    Figure 37. Example QC table, located in the center frame, below the main analysis figure.

    • Samples: the total number of cells/samples identified for the current analysis

    • Graph-based Clusters Post-QC : the number of cells/samples that remain after QC-filtering

    The remaining rows contain experimental overview statistics:

    • Barcoded Reads: total number of barcoded reads found for the experiment

    • Barcodes Identified: total number of barcodes identified

    • Reads per Barcode: average reads per barcode

    By clicking on the info icon in the first column of the second row (see Figure 38, top), the user can view a detailed overview of the QC methods that were selected for the current analysis (Figure 38, bottom).

    Figure 38a
    Figure 38b

    Figure 38. Info icon in the first column of the second row of the QC table (top). Provides detailed overview of QC methods currently in use (bottom).

  5. Gene Discovery menu

    The Gene Discovery menu in the upper-right sidebar contains information and user controls to find genes that distinguish individual clusters.

    Figure 39

    Figure 39. Gene Discovery menu.

    The data in this menu is produced from the differential expression (DE) module. The module calculates DE using the Wilcoxon Rank Sum test with a Benjamini-Hochberg correction for multiple comparisons. The test is performed for each gene for each group within the selected track. The within-group expression is tested against the background, skipping genes with either <0.5 natural logFC or expressed in <10% of both groups.

    The results are displayed in the Gene Discovery table, with the top 500 most differentially expressed genes displayed for the selected group. Scroll through the table to view genes of interest.

    Clicking on a given gene will display the expression on the UMAP/t-SNE plot.

    Figure 40

    Figure 40. Display of expression of specific gene (left) selected in the Gene Discovery menu (highlighted in blue, right).

    1. For a full list of the differentially expressed genes, click the download link at the top right of the table.

      Figure 41

      Figure 41. Download icon for the full list of differentially expressed genes. The list is downloaded as a .csv file.

    2. For graph-based clusters, K-means clusters, and any custom track selections, an [Update Cluster Label] button will appear below the Gene Discovery table to allow the user to update the selected cluster label.

      Figure 42

      Figure 42. Button for updating/customizing cluster labels.

      This may be useful for updating generic names such as 'Cluster 1' to informative names, once a cell type has been classified. For example, a cluster (e.g., 'Cluster 1') that has high expression of the gene MS4A1 may be identified as a B-cell cluster. Click to update the generic 'Cluster 1' to the desired label.

      Figure 43a    Figure 43b

      Figure 43. Example of 'Cluster 1' label updated to 'B-cell cluster'. This change is reflected both in the plot (left) and Gene Discovery table (right).

  6. Clustering menu

    The Clustering menu contains information and user controls on both dimensionality reduction and cluster identification approaches.

    Figure 44

    Figure 44. Clustering menu in right sidebar. The Clustering menu contains information and user controls on both dimensionality reduction (PCA and UMAP/t-SNE) and cluster identification approaches (graph-based and K-means clustering).

    The data in this menu is produced from the clustering module, which takes the top genes/features identified from the quality controlled, log-normalized data and uses them to perform a Principal Component Analysis (PCA). The top components from this analysis are then determined using a heuristic to find the elbow on the screen plot (with a default minimum of 8 principal components).

    The top components are used as the input for clustering and visualization (UMAP/t-SNE) and can be manually set by updating the "Input Principal Components" section of the menu.

    Figure 45

    Figure 45. "Input Principal Components" section of the Clustering menu.

    Clicking the [i] (info) button (Figure 46, top) for this field provides more information and plots to visualize the top principal components (PCs; Figure 46, bottom).

    Figure 46a   
    Figure 46b

    Figure 46. Accessing (top) information and plots (bottom) to visualize the top principal components.

    Clustering is performed on the top PCs using either a graph-based approach (adapted from Seurat) or K-means clustering. To switch between these methods, make the desired selection from the "Cluster Method" input within the menu.

    Figure 47

    Figure 47. "Cluster Method" section of the Clustering menu.

    Graph-based clustering is the default method used for identifying clusters. The granularity of the clusters can be changed by setting the "Resolution" parameter within the menu. Values closer to 0 will find broader structure in the data, while values closer to 1 and above will reveal finer structure.

    Figure 48a
    Figure 48b

    Figure 48. Two UMAP images of the same data with different "Resolution" values in the Clustering menu. The two examples illustrate how different values affect the display.

    K-means clusters are calculated for values of K = 2–15 by default. The optimal number of clusters from this set is determined using the Average Silhouette Score Method. Users may also select custom values of K to calculate and observe a desired number of clusters.

    Figure 49

    Figure 49. K-means Cluster menu.

    For visualization of this approach, click the [i] (info) button (Figure 50, top) within the menu.

    Figure 50a
    Figure 50b

    Figure 50. Accessing information (top) and plots (bottom) to visualize the K-means cluster approach.

F. Export the data

After applying any data manipulations from Section IV.E, it can be saved in its edited form.

  1. Expand the File Management option in the left sidebar menu and click the [Download] button.

    Figure 51

    Figure 51. The File Management submenu.

  2. Choose the type of file you wish to download from the dropdown menu. Available options are:

    • a high-resolution UMAP/t-SNE plot

    • an updated stats/metadata CSV file

    • a quality-controlled log-normalized gene matrix

    • a comprehensive HTML report of the analysis

    • a CogentDS R-object file to save changes to the analysis and share with colleagues

    Figure 52a   Figure 52b

    Figure 52. The Downloads pop-up menu and dropdown list of available file types.

  3. If desired, enter a custom file prefix.

  4. If downloading an HTML report, two additional fields are available (see Figure 53, below):

    1. (Optional) Enter a report author.

    2. (Required) Select an option for performing correlation analysis. This module is included in the HTML report and must be run. However, analysis can take a long time, so other options are available to either skip the analysis completely or perform the analysis on only the top genes used for clustering.

      NOTE: This HTML report is similar to the one generated from the Cogent NGS Analysis Pipeline but is now customized to your specifications made in CogentDS.

    Figure 53

    Figure 53. The Downloads pop-up menu for HTML reports.

Appendix

Columns in Stats file

The tables below document all potential columns that might display in a Cogent NGS Analysis Pipeline Stats file; they also represent the column names accepted for input into Cogent NGS Discovery Software.

Columns that will be present in all Stats files output by CogentAP (input workflow agnostic).

Column nameDescription
Barcode Detected barcodes. This value will usually be the sample name from the well-list or well-list-like file, but there are three exceptions, documented in the table below.
Sample Sample names described in sample description file.
Barcoded_Reads Number of reads after demultiplexing.
Trimmed_Reads Number of remained reads after trimming.
Unmapped_Reads Number of reads not mapped to genome.
Mapped_Reads Number of reads mapped to genome.
Multimapped_Reads Number of reads mapped to multiple genomic locations.
Uniquely_Mapped_Reads Number of reads mapped to one genomic location. These reads are used for counting.
Exon_Reads Number of reads assigned to an exonic region.
Ambiguous_Exon_Reads Number of reads assigned to exonic regions of multiple genes.
Intron_Reads Number of reads assigned to an intronic region.
Ambiguous_Intron_Reads Number of reads assigned to intronic regions of multiple genes.
Gene_Reads Number of reads assigned to a gene region (exon + intron).
Intergenic_Reads Number of reads assigned to an intergenic region.
No_of_Genes Number of detected genes.
Mitochondrial_Reads Number of reads assigned to mitochondrial chromosome.
Ribosomal_Reads Number of reads assigned to a ribosomal gene.

The "Barcode" column, in addition to the samples named in the well-list or well-list-like file, will also have three additional rows, which are described in the following table.

Barcode field valueDescription
Short Number of reads containing N in barcode or having shorter length than barcode.
Unselected Number of reads having a barcode included in Chip’s description, but not included in sample description file.
Undetermined Number of reads having undetermined barcode.

Additional columns in the Stats file for 3′ DE analysis with UMIs on ICELL8 system.

The table below lists additional columns that will be present in the Stats file when the input FASTQ files result from the ICELL8 3′ DE for UMI Reagent Kit (Cat # 640005) workflow on the ICELL8 Single-Cell System (Cat # 640000).

Column name Description
No_of_UMIs Number of UMI variations detected after demultiplexing.
Exon_nUMIs Number of deduplicated reads assigned to an exonic region. Deduplication is done by UMI.
Intron_nUMIs Number of deduplicated reads assigned to an intronic region. Deduplication is done by UMI.
Gene_nUMIs Number of deduplicated reads assigned to a gene region (exon + intron). Deduplication is done by UMI.

Additional columns in Stats file for the SMARTer Stranded Total RNA-Seq Kit v3- Pico Input Mammalian protocol.

The table below lists additional columns that will be present in the Stats file when the input FASTQ files result from the SMARTer Stranded Total RNA-Seq Kit v3- Pico Input Mammalian protocol.

Column name Description
No_of_UMIs Number of UMI variations detected after demultiplexing.
Exon_nUMIs Number of deduplicated reads assigned to an exonic region. Deduplication is done by UMI.
Exon_nUSSs Number of deduplicated reads assigned to an exonic region. Deduplication is done by Unique Start&Stop Site (USS).
Exon_nUMIs_USSs Number of deduplicated reads assigned to an exonic region. Deduplication is done by both UMI and USS.
Intron_nUMIs Number of deduplicated reads assigned to an intronic region. Deduplication is done by UMI.
Intron_nUSSs Number of deduplicated reads assigned to an intronic region. Deduplication is done by Unique Start&Stop Site (USS).
Intron_nUMIs_USSs Number of deduplicated reads assigned to an intronic region. Deduplication is done by both UMI and USS.
Gene_nUMIs Number of deduplicated reads assigned to a gene region (exon + intron). Deduplication is done by UMI.
Gene_nUSSs Number of deduplicated reads assigned to a gene region (exon + intron). Deduplication is done by Unique Start&Stop Site (USS).
Gene_nUMIs_USSs Number of deduplicated reads assigned to a gene region (exon + intron). Deduplication is done by both UMI and USS.
Strand_Specificity Ratio of reads detected as correct strand after mapping to genome.

RNA-seq

Cogent NGS Analysis Pipeline

Analyze sequencing data generated by select Takara Bio applications.

Cogent NGS Discovery Software

Visualize sequencing data using the output from the Cogent NGS Analysis Pipeline.

SMART-Seq DE3 Demultiplexer

Demultiplex sequencing data from SMART-Seq mRNA 3′ DE into sorted read data files.

Takara Bio USA, Inc.
United States/Canada: +1.800.662.2566 • Asia Pacific: +1.650.919.7300 • Europe: +33.(0)1.3904.6880 • Japan: +81.(0)77.565.6999
FOR RESEARCH USE ONLY. NOT FOR USE IN DIAGNOSTIC PROCEDURES. © 2025 Takara Bio Inc. All Rights Reserved. All trademarks are the property of Takara Bio Inc. or its affiliate(s) in the U.S. and/or other countries or their respective owners. Certain trademarks may not be registered in all jurisdictions. Additional product, intellectual property, and restricted use information is available at takarabio.com.

Takara Bio

Takara Bio USA, Inc. provides kits, reagents, instruments, and services that help researchers explore questions about gene discovery, regulation, and function. As a member of the Takara Bio Group, Takara Bio USA is part of a company that holds a leadership position in the global market and is committed to improving the human condition through biotechnology. Our mission is to develop high-quality innovative tools and services to accelerate discovery.

FOR RESEARCH USE ONLY. NOT FOR USE IN DIAGNOSTIC PROCEDURES (EXCEPT AS SPECIFICALLY NOTED).

Support
  • Contact us
  • Technical support
  • Customer service
  • Shipping & delivery
  • Sales
  • Feedback
Products
  • New products
  • Special offers
  • Instrument & reagent services
Learning centers
  • NGS
  • Gene function
  • Stem cell research
  • Protein research
  • PCR
  • Cloning
  • Nucleic acid purification
About
  • Our brands
  • Careers
  • Events
  • Blog
  • Need help?
  • Announcements
  • Quality and compliance
  • That's Good Science!
Facebook Twitter  LinkedIn

logo strip white

©2025 Takara Bio Inc. All Rights Reserved.

Region - North America Privacy Policy Terms and Conditions Terms of Use

Top


  • COVID-19 research
  • Viral detection with qPCR
  • SARS-CoV-2 pseudovirus
  • Human ACE2 stable cell line
  • Viral RNA isolation
  • Viral and host sequencing
  • Vaccine development
  • CRISPR screening
  • Drug discovery
  • Immune profiling
  • Publications
  • Next-generation sequencing
  • Spatial omics
  • RNA-seq
  • DNA-seq
  • Single-cell NGS automation
  • Reproductive health
  • Bioinformatics tools
  • Immune profiling
  • Real-time PCR
  • Great value master mixes
  • Signature enzymes
  • High-throughput real-time PCR solutions
  • Detection assays
  • References, standards, and buffers
  • Stem cell research
  • Media, differentiation kits, and matrices
  • Stem cells and stem cell-derived cells
  • mRNA and cDNA synthesis
  • In vitro transcription
  • cDNA synthesis kits
  • Reverse transcriptases
  • RACE kits
  • Purified cDNA & genomic DNA
  • Purified total RNA and mRNA
  • PCR
  • Most popular polymerases
  • High-yield PCR
  • High-fidelity PCR
  • GC rich PCR
  • PCR master mixes
  • Cloning
  • In-Fusion seamless cloning
  • Competent cells
  • Ligation kits
  • Restriction enzymes
  • Nucleic acid purification
  • Automated platforms
  • Plasmid purification kits
  • Genomic DNA purification kits
  • DNA cleanup kits
  • RNA purification kits
  • Gene function
  • Gene editing
  • Viral transduction
  • Fluorescent proteins
  • T-cell transduction and culture
  • Tet-inducible expression systems
  • Transfection reagents
  • Cell biology assays
  • Protein research
  • Purification products
  • Two-hybrid and one-hybrid systems
  • Mass spectrometry reagents
  • Antibodies and ELISAs
  • Primary antibodies and ELISAs by research area
  • Fluorescent protein antibodies
  • New products
  • Special offers
  • OEM
  • Portfolio
  • Process
  • Facilities
  • Request samples
  • FAQs
  • Instrument services
  • Apollo services
  • ICELL8 services
  • SmartChip ND system services
  • Gene and cell therapy manufacturing services
  • Services
  • Facilities
  • Our process
  • Resources
  • Customer service
  • Sales
  • Make an appointment with your sales rep
  • Shipping & delivery
  • Technical support
  • Feedback
  • Online tools
  • GoStix Plus FAQs
  • Partnering & Licensing
  • Vector information
  • Vector document overview
  • Vector document finder
Takara Bio's award-winning GMP-compliant manufacturing facility in Kusatsu, Shiga, Japan.

Partner with Takara Bio!

Takara Bio is proud to offer GMP-grade manufacturing capabilities at our award-winning facility in Kusatsu, Shiga, Japan.

  • Automation systems
  • Shasta Single Cell System introduction
  • SmartChip Real-Time PCR System introduction
  • ICELL8 introduction
  • Next-generation sequencing
  • RNA-seq
  • Technical notes
  • Technology and application overviews
  • FAQs and tips
  • DNA-seq protocols
  • Bioinformatics resources
  • Webinars
  • Spatial biology
  • Real-time PCR
  • Download qPCR resources
  • Overview
  • Reaction size guidelines
  • Guest webinar: extraction-free SARS-CoV-2 detection
  • Technical notes
  • Nucleic acid purification
  • Nucleic acid extraction webinars
  • Product demonstration videos
  • Product finder
  • Plasmid kit selection guide
  • RNA purification kit finder
  • mRNA and cDNA synthesis
  • mRNA synthesis
  • cDNA synthesis
  • PCR
  • Citations
  • PCR selection guide
  • Technical notes
  • FAQ
  • Cloning
  • Automated In-Fusion Cloning
  • In-Fusion Cloning general information
  • Primer design and other tools
  • In‑Fusion Cloning tips and FAQs
  • Applications and technical notes
  • Stem cell research
  • Overview
  • Protocols
  • Technical notes
  • Gene function
  • Gene editing
  • Viral transduction
  • T-cell transduction and culture
  • Inducible systems
  • Cell biology assays
  • Protein research
  • Capturem technology
  • Antibody immunoprecipitation
  • His-tag purification
  • Other tag purification
  • Expression systems
  • Antibodies and ELISA
  • Molecular diagnostics
  • Interview: adapting to change with Takara Bio
  • Applications
  • Solutions
  • Partnering
  • Contact us
  • mRNA and protein therapeutics
  • Characterizing the viral genome and host response
  • Identifying and cloning protein targets
  • Expressing and purifying protein targets
  • Immunizing mice and optimizing vaccines
  • Pathogen detection
  • Sample prep
  • Detection methods
  • Identification and characterization
  • SARS-CoV-2
  • Antibiotic-resistant bacteria
  • Food crop pathogens
  • Waterborne disease outbreaks
  • Viral-induced cancer
  • Immunotherapy research
  • T-cell therapy
  • Antibody therapeutics
  • T-cell receptor profiling
  • TBI initiatives in cancer therapy
  • Cancer research
  • Kickstart your cancer research with long-read sequencing
  • Sample prep from FFPE tissue
  • Sample prep from plasma
  • Cancer biomarker quantification
  • Single cancer cell analysis
  • Cancer transcriptome analysis
  • Cancer genomics and epigenomics
  • HLA typing in cancer
  • Gene editing for cancer therapy/drug discovery
  • Alzheimer's disease research
  • Antibody engineering
  • Sample prep from FFPE tissue
  • Single-cell sequencing
  • Reproductive health technologies
  • Embgenix FAQs
  • Preimplantation genetic testing
  • ESM partnership program
  • ESM Collection Kit forms
  • Infectious diseases
  • Develop vaccines for HIV
Create a web account with us

Log in to enjoy additional benefits

Want to save this information?

An account with takarabio.com entitles you to extra features such as:

•  Creating and saving shopping carts
•  Keeping a list of your products of interest
•  Saving all of your favorite pages on the site*
•  Accessing restricted content

*Save favorites by clicking the star () in the top right corner of each page while you're logged in.

Create an account to get started

  • BioView blog
  • Automation
  • Cancer research
  • Career spotlights
  • Current events
  • Customer stories
  • Gene editing
  • Research news
  • Single-cell analysis
  • Stem cell research
  • Tips and troubleshooting
  • Women in STEM
  • That's Good Support!
  • About our blog
  • That's Good Science!
  • SMART-Seq Pro Biomarker Discovery Contest
  • DNA extraction educational activity
  • That's Good Science Podcast
  • Season one
  • Season two
  • Season three
  • Our brands
  • Our history
  • In the news
  • Events
  • Biomarker discovery events
  • Calendar
  • Conferences
  • Speak with us
  • Careers
  • Company benefits
  • Trademarks
  • License statements
  • Quality statement
  • HQ-grade reagents
  • International Contacts by Region
  • United States and Canada
  • China
  • Japan
  • Korea
  • Europe
  • India
  • Affiliates & distributors
  • Need help?
  • Privacy request
  • Website FAQs

That's GOOD Science!

What does it take to generate good science? Careful planning, dedicated researchers, and the right tools. At Takara Bio, we thoughtfully develop exceptional products to tackle your most challenging research problems, and have an expert team of technical support professionals to help you along the way, all at superior value.

Explore what makes good science possible

 Customer Login
 View Cart (0)
Takara Bio
  • Home
  • Products
  • Services & Support
  • Learning centers
  • APPLICATIONS
  • About
  • Contact Us
  •  Customer Login
  • Register
  •  View Cart (0)

Takara Bio USA, Inc. provides kits, reagents, instruments, and services that help researchers explore questions about gene discovery, regulation, and function. As a member of the Takara Bio Group, Takara Bio USA is part of a company that holds a leadership position in the global market and is committed to improving the human condition through biotechnology. Our mission is to develop high-quality innovative tools and services to accelerate discovery.

FOR RESEARCH USE ONLY. NOT FOR USE IN DIAGNOSTIC PROCEDURES (EXCEPT AS SPECIFICALLY NOTED).

Clontech, TaKaRa, cellartis

  • Products
  • COVID-19 research
  • Next-generation sequencing
  • Real-time PCR
  • Stem cell research
  • mRNA and cDNA synthesis
  • PCR
  • Cloning
  • Nucleic acid purification
  • Gene function
  • Protein research
  • Antibodies and ELISA
  • New products
  • Special offers
  • COVID-19 research
  • Viral detection with qPCR
  • SARS-CoV-2 pseudovirus
  • Human ACE2 stable cell line
  • Viral RNA isolation
  • Viral and host sequencing
  • Vaccine development
  • CRISPR screening
  • Drug discovery
  • Immune profiling
  • Publications
  • Next-generation sequencing
  • Spatial omics
  • RNA-seq
  • DNA-seq
  • Single-cell NGS automation
  • Reproductive health
  • Bioinformatics tools
  • Immune profiling
  • Real-time PCR
  • Great value master mixes
  • Signature enzymes
  • High-throughput real-time PCR solutions
  • Detection assays
  • References, standards, and buffers
  • Stem cell research
  • Media, differentiation kits, and matrices
  • Stem cells and stem cell-derived cells
  • mRNA and cDNA synthesis
  • In vitro transcription
  • cDNA synthesis kits
  • Reverse transcriptases
  • RACE kits
  • Purified cDNA & genomic DNA
  • Purified total RNA and mRNA
  • PCR
  • Most popular polymerases
  • High-yield PCR
  • High-fidelity PCR
  • GC rich PCR
  • PCR master mixes
  • Cloning
  • In-Fusion seamless cloning
  • Competent cells
  • Ligation kits
  • Restriction enzymes
  • Nucleic acid purification
  • Automated platforms
  • Plasmid purification kits
  • Genomic DNA purification kits
  • DNA cleanup kits
  • RNA purification kits
  • Gene function
  • Gene editing
  • Viral transduction
  • Fluorescent proteins
  • T-cell transduction and culture
  • Tet-inducible expression systems
  • Transfection reagents
  • Cell biology assays
  • Protein research
  • Purification products
  • Two-hybrid and one-hybrid systems
  • Mass spectrometry reagents
  • Antibodies and ELISA
  • Primary antibodies and ELISAs by research area
  • Fluorescent protein antibodies
  • Services & Support
  • OEM
  • Instrument services
  • Gene and cell therapy manufacturing
  • Customer service
  • Sales
  • Shipping & delivery
  • Technical support
  • Feedback
  • Online tools
  • Partnering & Licensing
  • Vector information
  • OEM
  • Portfolio
  • Process
  • Facilities
  • Request samples
  • FAQs
  • Instrument services
  • Apollo services
  • ICELL8 services
  • SmartChip ND system services
  • Gene and cell therapy manufacturing
  • Services
  • Facilities
  • Our process
  • Resources
  • Sales
  • Make an appointment with your sales rep
  • Online tools
  • GoStix Plus FAQs
  • Vector information
  • Vector document overview
  • Vector document finder
  • Learning centers
  • Automation systems
  • Next-generation sequencing
  • Spatial biology
  • Real-time PCR
  • Nucleic acid purification
  • mRNA and cDNA synthesis
  • PCR
  • Cloning
  • Stem cell research
  • Gene function
  • Protein research
  • Antibodies and ELISA
  • Automation systems
  • Shasta Single Cell System introduction
  • SmartChip Real-Time PCR System introduction
  • ICELL8 introduction
  • Next-generation sequencing
  • RNA-seq
  • Technical notes
  • Technology and application overviews
  • FAQs and tips
  • DNA-seq protocols
  • Bioinformatics resources
  • Webinars
  • Real-time PCR
  • Download qPCR resources
  • Overview
  • Reaction size guidelines
  • Guest webinar: extraction-free SARS-CoV-2 detection
  • Technical notes
  • Nucleic acid purification
  • Nucleic acid extraction webinars
  • Product demonstration videos
  • Product finder
  • Plasmid kit selection guide
  • RNA purification kit finder
  • mRNA and cDNA synthesis
  • mRNA synthesis
  • cDNA synthesis
  • PCR
  • Citations
  • PCR selection guide
  • Technical notes
  • FAQ
  • Cloning
  • Automated In-Fusion Cloning
  • In-Fusion Cloning general information
  • Primer design and other tools
  • In‑Fusion Cloning tips and FAQs
  • Applications and technical notes
  • Stem cell research
  • Overview
  • Protocols
  • Technical notes
  • Gene function
  • Gene editing
  • Viral transduction
  • T-cell transduction and culture
  • Inducible systems
  • Cell biology assays
  • Protein research
  • Capturem technology
  • Antibody immunoprecipitation
  • His-tag purification
  • Other tag purification
  • Expression systems
  • APPLICATIONS
  • Molecular diagnostics
  • mRNA and protein therapeutics
  • Pathogen detection
  • Immunotherapy research
  • Cancer research
  • Alzheimer's disease research
  • Reproductive health technologies
  • Infectious diseases
  • Molecular diagnostics
  • Interview: adapting to change with Takara Bio
  • Applications
  • Solutions
  • Partnering
  • Contact us
  • mRNA and protein therapeutics
  • Characterizing the viral genome and host response
  • Identifying and cloning protein targets
  • Expressing and purifying protein targets
  • Immunizing mice and optimizing vaccines
  • Pathogen detection
  • Sample prep
  • Detection methods
  • Identification and characterization
  • SARS-CoV-2
  • Antibiotic-resistant bacteria
  • Food crop pathogens
  • Waterborne disease outbreaks
  • Viral-induced cancer
  • Immunotherapy research
  • T-cell therapy
  • Antibody therapeutics
  • T-cell receptor profiling
  • TBI initiatives in cancer therapy
  • Cancer research
  • Kickstart your cancer research with long-read sequencing
  • Sample prep from FFPE tissue
  • Sample prep from plasma
  • Cancer biomarker quantification
  • Single cancer cell analysis
  • Cancer transcriptome analysis
  • Cancer genomics and epigenomics
  • HLA typing in cancer
  • Gene editing for cancer therapy/drug discovery
  • Alzheimer's disease research
  • Antibody engineering
  • Sample prep from FFPE tissue
  • Single-cell sequencing
  • Reproductive health technologies
  • Embgenix FAQs
  • Preimplantation genetic testing
  • ESM partnership program
  • ESM Collection Kit forms
  • Infectious diseases
  • Develop vaccines for HIV
  • About
  • BioView blog
  • That's Good Science!
  • Our brands
  • Our history
  • In the news
  • Events
  • Careers
  • Trademarks
  • License statements
  • Quality and compliance
  • HQ-grade reagents
  • International Contacts by Region
  • Need help?
  • Website FAQs
  • BioView blog
  • Automation
  • Cancer research
  • Career spotlights
  • Current events
  • Customer stories
  • Gene editing
  • Research news
  • Single-cell analysis
  • Stem cell research
  • Tips and troubleshooting
  • Women in STEM
  • That's Good Support!
  • About our blog
  • That's Good Science!
  • SMART-Seq Pro Biomarker Discovery Contest
  • DNA extraction educational activity
  • That's Good Science Podcast
  • Season one
  • Season two
  • Season three
  • Events
  • Biomarker discovery events
  • Calendar
  • Conferences
  • Speak with us
  • Careers
  • Company benefits
  • International Contacts by Region
  • United States and Canada
  • China
  • Japan
  • Korea
  • Europe
  • India
  • Affiliates & distributors
  • Need help?
  • Privacy request
Takara Bio
  • Products
  • Services & Support
  • Learning centers
  • APPLICATIONS
  • About
  • Contact Us