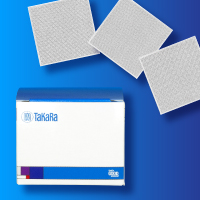
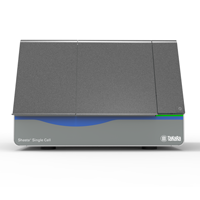
Full-length, single-cell RNA-seq with the ICELL8 Single-Cell System
The data presented here demonstrate that the ICELL8 Single-Cell System can be used to generate high-quality RNA-seq libraries that provide full-length transcript sequence information from hundreds of single cells in parallel. Our method for full-length single-cell RNA-seq using the ICELL8 system enables users to perform all reactions required for Illumina NGS library preparation in ICELL8 chips, including cDNA synthesis and PCR amplification so that the output from the chip is a sequencing-ready library. Along with incorporating SMART template-switching technology to ensure production of high-quality cDNA, our method enables various single-cell analyses to be performed with high sensitivity and reproducibility.
Full-length RNA-seq library preparation workflow

ICELL8 library preparation workflow for full-length single-cell RNA-seq with SMART technology. After selection of wells containing single, live cells, cDNA is synthesized via oligo-dT priming in a one-step RT-PCR reaction (Step 2). P5 indexing primers for subsequent library preparation are indexed into all wells, with each of the 72 rows on the ICELL8 chip receiving a different index, in addition to Terra polymerase and reaction buffer (Step 3). Transposition enzyme and reaction buffer (Tn5 mixture) are dispensed to selected wells (Step 4), and the transposition reaction is performed (Step 5). P7 indexing primers are dispensed to wells, with each of the 72 columns on the chip receiving a different index (Step 6). Final Illumina libraries are amplified (Step 7) and pooled as they are extracted from the chip. Pooled libraries are cleaned with subsequent bead purification and quantified before loading on an Illumina sequencer.
Gene-body coverage

Assessment of gene-body coverage for representative samples. Lengths of gene bodies encoded by the human genome were normalized, and coverage by mapped reads from two different isolated K562 cells was plotted along the normalized gene body (positions within the normalized gene body are represented as percentages on X-axis). Coverage (represented on a scale of 0 to 1 on Y-axis) was normalized relative to the maximum coverage observed along the normalized gene body.
Read-mapping distributions for data generated from single cells

Sequencing metrics for selected samples (K562 cells). Histograms representing the percentages of reads that map to the indicated regions of the human genome: exons (orange), introns (blue), or intergenic regions (gray). The dark blue line overlaid on the histogram represents the number of transcripts identified with an RPKM value >0.1 for each well. Numbers along the bottom of each histogram indicate the corresponding positions on the chip of the qualifying single cell-containing wells from which the data were obtained.
Relationship between read depth and number of transcripts identified

Relationship between read depth and number of transcripts identified for three single-cell containing wells. The graphs indicate the number of transcripts identified at varying read depths for each of three K562 cell-containing wells.
Reproducibility of gene expression measurements

Reproducibility of gene expression measurements. To assess the reproducibility of full-length RNA-seq data generated with the ICELL8 system, gene expression measurements for all transcripts identified were used to determine Pearson correlations between all single-cell containing wells, as indicated by the heatmap.
Takara Bio USA, Inc.
United States/Canada: +1.800.662.2566 • Asia Pacific: +1.650.919.7300 • Europe: +33.(0)1.3904.6880 • Japan: +81.(0)77.565.6999
FOR RESEARCH USE ONLY. NOT FOR USE IN DIAGNOSTIC PROCEDURES. © 2025 Takara Bio Inc. All Rights Reserved. All trademarks are the property of Takara Bio Inc. or its affiliate(s) in the U.S. and/or other countries or their respective owners. Certain trademarks may not be registered in all jurisdictions. Additional product, intellectual property, and restricted use information is available at takarabio.com.


