Normal cells can be transformed into malignant tumor cells by acquiring a series of somatic mutation events, such as copy number variations (CNVs). CNVs are extremely common in tumors and are also well-known for driving tumor progression. To identify actionable biomarkers and formulate optimal treatment strategies, we need to understand the driving mutations in individual cells of tumor tissues. Single-cell DNA-seq (scDNA-seq) was developed to answer these scientific questions. However, current scDNA-seq methods for CNV profiling have several major drawbacks. Targeted panels can profile single-cell CNVs in a high-throughput manner, but they lack whole-genome coverage and cannot be used for the detection of arm-level CNVs. Existing methods with whole-genome coverage have not been scaled up to satisfy the need for high-throughput testing. To address these limitations, we have developed the Shasta Whole-Genome Amplification (Shasta WGA) Kit, which has a workflow based on our gold-standard PicoPLEX technology (Figure 1, Panel A). Libraries generated have high rates of mapping and unique reads (Figure 1, Panel B). Shasta WGA enables single-cell CNV profiling with whole-genome coverage for up to 1,500 single cells per experiment. This high-throughput method, which has been optimized on our Shasta Single-Cell System, is paired with key updates to the freely available Cogent NGS tools, enabling you to analyze your scDNA-seq data seamlessly and comprehensively.
Tech note
High-throughput profiling of copy number variation at single-cell resolution
Introduction
Results
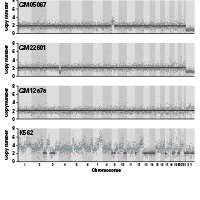
To assess how the Shasta WGA kit can be utilized for single-cell CNV profiling, we tested its performance in two cell lines with well-characterized CNV profiles: GM22601 (25Mb deletion on Chromosome 4) and GM05067 (45Mb gain on Chromosome 9) along with control cell lines (K562 and GM12878). WGA libraries for a total of 1,288 single cells were generated and sequenced on Illumina NextSeq 500 at 250,000 read pairs per single cell. We were able to detect the deletion on Chromosome 4 in GM22601 and gain on Chromosome 9 in GM05067. In K562 cells, we also detected multiple chromosomal aneuploidies as expected (Figure 2). Four cell lines were processed together and showed distinct CNV profiles indicating that the Shasta WGA kit can be applied to deconvolute heterogeneity in tumor samples. These data demonstrate that Shasta WGA can reliably detect CNV events at 250,000 read pairs per single cell at a lower sequencing cost compared to current plate-based single-cell WGA methods which require a minimum of 2–5 million reads per cell for similar CNV information.
To further demonstrate that Shasta WGA can detect single-cell CNVs in oncology research, we first assessed the performance of Shasta WGA data by chromosome, and found that the Shasta WGA kit yielded even coverage with a mean of 0.97-1.02 (SD = 0.2) across different chromosomes after normalization (Figure 3, Panel A). Even amplification of the genome is needed for accurate CNV analysis as CNV calling can be hampered by uneven amplification, with regions which are over- or under-amplified appearing as CNVs. We examined the coverage uniformity across the whole genome in GM22601 cells on the Lorenz Curve (Figure 3, Panel B), which displays the variation of amplification by plotting the cumulative fraction of reads as a function of the cumulative fraction of the genome. We verified that Shasta WGA showed outstanding coverage uniformity, as indicated by the proximity between the cumulative fraction of total reads and the genome. The libraries generated using the Shasta WGA kit have comparable uniformity of coverage as the plate-based PicoPLEX chemistry and better uniformity of coverage than the MDA-based Xdrop WGA Kit (Kalef-Ezra, E. et al. 2023), indicating that the whole genome gets amplified evenly for accurate CNV calling. Last, we tested the performance of Shasta WGA in challenging genomic regions with over 55% GC content and found it displayed excellent coverage for these GC-rich regions (Figure 3, Panel C).
Figure 3. Data quality of Shasta WGA libraries. Panel A. Bar graph of normalized reads show even coverage. Normalized reads per chromosome were calculated by dividing the percentage of total reads aligned to a specific chromosome by the percentage of the chromosome within the total genome. Panel B. Lorenz curve of libraries indicating uniformity of coverage. Lorenz curve was plotted by the cumulative fraction of the genome versus the cumulative fraction of total reads. Perfect coverage uniformity is represented by the straight dotted line. Panel C. Uniform coverage across genomic regions with various GC content. Lowess (locally weighted scatterplot smoothing) curves were calculated to assess the effect of GC bias on read depth. The curve was plotted as the Lowess fit of GC content with respect to log normalized bin counts.
Conclusion
The Shasta WGA workflow allows scientists to prepare single-cell WGA libraries for up to 1,500 single cells per experiment and enables the reliable detection of CNVs for tumor subclonal analysis at a shallow sequencing depth of only 250,000 read pairs per cell. With a total reaction volume of 300 nl per cell and automated dispensing, the Shasta WGA technology offers a significant reduction in reagent use as compared to plate-based methods.
Methods
Hoechst-stained single cells were dispensed into a 5,184-nanowell chip and screened by imaging. Reagents dispensed in nanowells include: a lysis mix to release DNA from nuclei, a pre-amplification mix during which quasi-random primers amplify random locations of the genome, a PCR mix, and two indexing primer dispenses to amplify the libraries while simultaneously incorporating a unique barcode for each single cell. The pooled barcoded libraries were sent for Illumina® sequencing after off-chip purification.
Library sequencing was performed using a NextSeq® 500/550 High Output Kit with a 150-cycle cartridge (read length 2 x 75 bp) with a PhiX spike-in percentage of 18.81%. Ginkgo was used for CNV calling. The average read depth for a single cell was 250,000 and the average bin size for segmentation was 1 Mb.
References
Takara Bio USA, Inc.
United States/Canada: +1.800.662.2566 • Asia Pacific: +1.650.919.7300 • Europe: +33.(0)1.3904.6880 • Japan: +81.(0)77.565.6999
FOR RESEARCH USE ONLY. NOT FOR USE IN DIAGNOSTIC PROCEDURES. © 2023 Takara Bio Inc. All Rights Reserved. All trademarks are the property of Takara Bio Inc. or its affiliate(s) in the U.S. and/or other countries or their respective owners. Certain trademarks may not be registered in all jurisdictions. Additional product, intellectual property, and restricted use information is available at takarabio.com.