Accurate aneuploidy detection with the Embgenix PGT-A Kit
The Embgenix PGT-A Kit is an end-to-end solution for next-generation sequencing (NGS)-based preimplantation genetic testing of embryos for aneuploidies (PGT-A)
The kit integrates PicoPLEX whole-genome amplification (WGA), Illumina library preparation, and automated analysis software to streamline the assessment of trophectoderm (TE) biopsy and genomic DNA (gDNA) samples for whole chromosome and segmental aneuploidies and mosaicisms
The kit features a streamlined workflow with less than 2 hours of hands-on time and a single dilution factor following WGA; unique dual indexes are provided in a ready-to-use plate format to enable preparation of Illumina libraries and multiplexing of up to 96 samples
Cloud-based Embgenix Analysis Software employs a proprietary algorithm for automated assessment of copy number variations (CNVs) from sequencing data generated with the Embgenix PGT-A Kit
The Embgenix PGT-A workflow enables fast and accurate detection of segmental aneuploidies ≥10 Mb and low (30–50%) and high (50–70%) mosaicisms
The aim of this study was for multiple laboratories—Takara Bio’s in-house laboratory and independent clinical laboratories A, B, and C—to test the performance of the Embgenix PGT-A Kit in detecting copy number variations (CNVs), such as whole chromosome, segmental, and mosaic aneuploidies in TE biopsy and gDNA samples.
NGS is the method of choice for PGT-A of in vitro fertilization (IVF) embryos (Vendrell et al. 2017). The overall goal of PGT-A is to improve rates of embryo implantation and live birth by enabling assessment and prioritization of embryos for transfer on the basis of copy number status in addition to other established criteria (Kemper et al. 2019). With integrated workflows from sample preparation to analysis, NGS-based PGT-A offers a simpler, more scalable solution for aneuploidy screening as compared to preceding methods.
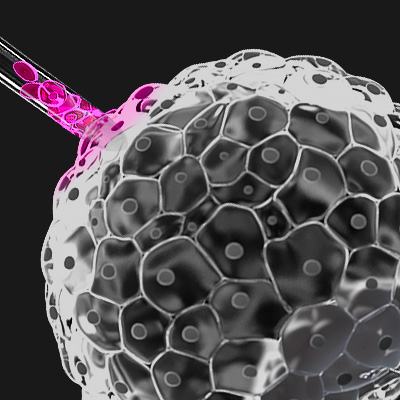
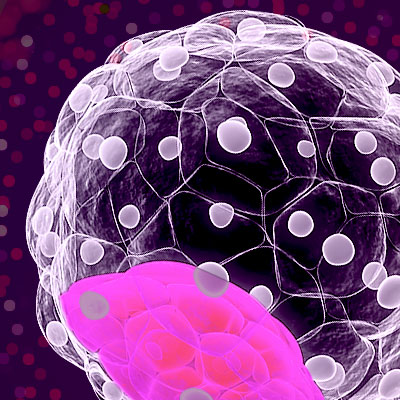
Leveraging Takara Bio’s technologies for WGA and library preparation and a customized bioinformatics pipeline, Embgenix PGT-A is an end-to-end solution for detection of whole chromosome, segmental, and mosaic aneuploidies in human embryos. The Embgenix PGT-A Kit has been optimized to analyze DNA obtained from embryo biopsies or genomic DNA. The workflow starts with cell lysis and PicoPLEX WGA from template DNA followed by library preparation and incorporation of unique dual indexes (UDI). Following purification, quantification, and pooling, libraries are ready for multiplex sequencing on Illumina NGS platforms (Figure 1).
Figure 1. Embgenix PGT-A workflow. Starting from cells or gDNA, up to 96 Illumina-ready sequencing libraries can be generated in parallel in six to eight hours.
PicoPLEX WGA, used to generate enough DNA for NGS library preparation, is shown in Figure 2. PicoPLEX is the gold standard for PGT-A applications by virtue of its superior reproducibility, fidelity, and uniformity as compared to other WGA methods (Zhang et al. 2017). WGA products are enzymatically fragmented and then stem-loop adapters and UDI are incorporated to yield high-quality Illumina-ready libraries (Figure 3). Sequencing and analysis of the libraries enables accurate screening of all 24 chromosomes for whole- and sub-chromosomal CNVs.
Figure 2. Takara Bio’s PicoPLEX WGA chemistry. WGA products are generated from gDNA extracted from TE biopsy samples via cell lysis. Pre-amplification and amplification steps are integrated in a single-tube workflow to generate the WGA product for library preparation.
Figure 3. Takara Bio's patented library preparation method. WGA products are enzymatically fragmented and ligated with stem-loop adapters, followed by UDI incorporation via PCR. Libraries are then ready for sequencing on Illumina platforms.
Following sequencing, cloud-based Embgenix Analysis Software (Figure 4) is used to analyze sequencing data from each sample. With Human genome build 38 (hg38) as an alignment reference, CNVs are identified and displayed in CNV plots as well as idiogram and list formats. Via a web-browser, users can easily perform CNV analysis, interactively review and amend CNV calls, and generate downloadable PDF reports with a variety of customizable features.
Figure 4. Embgenix Analysis Software: general workflow for CNV detection and reporting
Results
Detection of full chromosome and segmental aneuploidies in gDNA samples
The first study, using previously characterized gDNA samples, evaluated the feasibility and reliability of the Embgenix PGT-A Kit in detecting full-chromosome and segmental aneuploidies. The Embgenix software detected chromosomal abnormalities affecting whole chromosomes with high accuracy and confidence. An example plot resulting from this study is shown in Figure 5.
Figure 5. Embgenix plot showing result for genomic DNA sample containing trisomy of Chr18.
The Embgenix PGT-A Kit was applied to analyze 22 reference specimens with segmental aneuploidies. Embgenix PGT-A successfully detected 100% of the segmental aneuploidies, which ranged in size from 7.1 Mb to 91.4 Mb, with no false positives called. For 20 of the 22 segmental aneuploidies, Embgenix PGT-A provided highly accurate estimates (within 15%) of CNV size (Table 1). Figure 6 shows example plots of accurate calls by Embgenix PGT-A for relevant CNV structures requiring high resolution of segmental detection (Coriell samples NA13019 and NA14485). In some rare cases, the CNV lies across a region of the genome where it is difficult to perform read mapping, the process of aligning reads to the reference genome. These “low mappability regions” may be excluded from the reported CNV size, resulting in significant underestimation of the reported CNV size. The underestimation of size for one CNV in Coriell sample NA20556 may have arisen due to this issue, as that CNV extends into a low mappability region.
Table 1. Study with 22 samples, showing accurate reporting of segmental aneuploidies including size prediction.
Takara Bio’s in-house verification
Coriell Sample
Chr
True CNV Size (Mb)
Embgenix PGT-A Predicted Size (Mb)
NA20022
Chr3
61.1
64
NA14164
Chr13
41.2
48
NA12606
Chr13
41.2
42
NA09367
Chr6
35.2
35
NA11672
Chr10
26.2
26
NA10800
Chr4
25.2
26
NA05966
Chr14
21.2
21
NA11213
Chr2
17.5
18
NA09216
Chr2
16.7
17
NA08331
Chr13
12.1
13
NA10989
Chr9
12
12
NA14943
Chr2
7.8
9
Independent testing at Clinical Laboratory A
Coriell Sample
Chr
True CNV Size (Mb)
Embgenix PGT-A Predicted Size (Mb)
NA13019
ChrX
91.4
98
NA13019
ChrX
56.8
59
NA14485
Chr8
31.1
34
NA06226
Chr16
21.3
22
NA05966
Chr14
21.2
22
NA06870
Chr18
15.4
15
NA20556
Chr15
12.3
7**
NA08331
Chr13
12.1
13
NA16362
Chr22
8*
8
NA14485
Chr8
7.1*
7
*CNV size less than minimum specification for Embgenix Analysis Software. **CNV occurred in region with low mappability.
Figure 6. Analysis using the Embgenix PGT-A Kit demonstrates concordance with previously characterized segmental aneuploidy.Panel A. Embgenix PGT-A correctly predicts two segmental aneuploidies in ChrX, linked to Turner Syndrome, in Coriell gDNA sample NA13019. Panel B. Embgenix PGT-A correctly predicts two segmental aneuploidies in Chr8, linked to hydrocephalus, in Coriell gDNA sample NA14485.
Detection of mosaicism
Next, we tested the accuracy of mosaic detection by Embgenix PGT-A. Two clinical laboratories, A and B, performed studies using mosaic samples created using mixtures of two samples with different aneuploidies. Laboratory A used mixtures of Coriell gDNA samples NA05966 (21.2 Mb trisomy in Chr14) and NA10925 (16.1 Mb monosomy in Chr7). The ratios tested are shown in Figure 7, which presents the results of the study as a comparison between Embgenix PGT-A and another NGS PGT-A method, Reproseq. Embgenix PGT-A successfully detected the segmental mosaicisms represented in the gDNA mixtures at 50% and 75%. Reproseq did not detect the mosaicisms at 50% and 75%.
Figure 7. Comparison of mosaic detection capability between Embgenix PGT-A and Reproseq. Sensitivity of mosaic detection is compared side-by-side for Embgenix PGT-A and Reproseq, using artificial segmental mosaicisms generated by mixing two Coriell gDNA samples (NA05966 and NA10925) containing segmental aneuploidies in different genomic locations. The two Coriell gDNA samples were mixed at the five ratios indicated. CNVs reported by each method are marked as true positives (blue arrows) or false negatives (red squares), with no false positives reported by either method.
The second Clinical Laboratory, B, performed a study using two gDNA samples with known CNVs. The first of these samples contained a 14 Mb segmental monosomy of Chr11. The second gDNA sample contained trisomy of Chr18 (78 Mb). Seven mixtures of these two gDNA samples were prepared. The resulting mixtures were processed using Embgenix PGT-A and Embgenix Analysis Software.
As shown in Table 2, Embgenix PGT-A successfully detected the Chr18 trisomy in all mosaic mixtures tested. Embgenix PGT-A successfully detected the 14 Mb Chr11 aneuploidy in mosaics where the sample with that aneuploidy made up at least 40% of the mixture.
Table 2. Study of mosaic mixture demonstrating detection of full chromosome aneuploidy (78 Mb) and 14 Mb segmental aneuploidy.
Embgenix PGT-A Kit validation using biopsy samples
% mosaicism Chr11, 14 Mb segmental
% mosaicism Chr18, full chromosome
Embgenix PGT-A detection: Chr11, 14 Mb segmental
Embgenix PGT-A detection: Chr18, full chromosome
80%
20%
Yes
Yes
70%
30%
Yes
Yes
60%
40%
Yes
Yes
50%
50%
Yes
Yes
40%
60%
Yes
Yes
30%
70%
No
Yes
20%
80%
No
Yes
Multiple IVF clinics collaborated to validate the performance of Embgenix PGT-A with TE biopsy samples. The table in Figure 8, Panel A summarizes two independent datasets generated in laboratories at two separate clinics, B and C. In the study performed by Clinical Laboratory B, 34 samples (including 26 TE samples and 8 gDNA samples) were analyzed using Embgenix PGT-A with Embgenix Analysis Software and VeriSeq PGS Kit with BlueFuse Multi Software. Embgenix results were 91% concordant with results obtained from the clinic's established NGS PGT-A analysis method. The three samples generating non-concordant results were from the same embryo. Clinical laboratory B determined these samples probably came from parts of the embryo with different genetic content.
In the study performed by Clinical Laboratory C, multiple biopsies from the trophectoderm (TE) or inner cell mass (ICM) of 71 embryos were analyzed using Embgenix PGT-A and other NGS PGT-A methods and software. Embgenix results were 100% concordant with results obtained from the established NGS PGT-A analysis for each embryo. Figure 8, Panels B, C, and D show a representative example comparing analysis of two TE samples and one ICM sample from Embryo 9. The results of analysis with Embgenix PGT-A were 100% concordant with data obtained by sample analysis with established methods and software. Figure 9 shows results for another example from this study, Embryo 47.
Clinical Laboratory
Sample composition
Concordance
B
26 TE biopsies and 8 gDNA samples
91%
C
TE or ICM biopsies from 71 embryos
100%
Figure 8. Aneuploidy assessments conducted by Clinical Laboratories B and C demonstrate concordance between results from Embgenix PGT-A analysis and results from established PGT-A methods. Representative example data from Embryo 9 are shown in Panels B–C. Aneuploidy assessment of two TE biopsies and one ICM biopsy were performed using Embgenix PGT-A and an established method, VeriSeq PGS Kit with BlueFuse Multi Software. All analyses indicated monosomy of Chr5. Panel A. Table summarizing Embgenix PGT-A performance on datasets from collaborating IVF clinics. Panel B. Data from a TE sample assessed with VeriSeq PGS Kit with BlueFuse Multi Software. Panel C. Data from a ICM sample assessed with Embgenix PGT-A and Embgenix Analysis Software. Panel D. Data from a TE sample assessed with Embgenix PGT-A and Embgenix Analysis Software.
Figure 9. Aneuploidy assessment conducted by Clinical Laboratory C demonstrates concordance between results from Embgenix PGT-A analysis and results from established PGT-A methods. Representative example data from Embryo 47 is shown. Results from analysis of biopsy samples processed with Embgenix PGT-A and another PGT-A method are in concordance, indicating monosomy of Chr16. Panel A. Data from a TE sample processed with an established NGS PGT-A method and software. Panel B. Data from a TE sample processed with Embgenix PGT-A and Embgenix Analysis Software.
Conclusion
We have shown that the Embgenix PGT-A Kit, by incorporating PicoPLEX WGA, Illumina library preparation, and Embgenix Analysis Software for copy number assessment, provides a complete solution for PGT-A.
Our study data demonstrate that Embgenix PGT-A rapidly and accurately calls whole chromosome and segmental aneuploidies greater than 10 Mb, as well as low (30–50%) and high (50–70%) mosaicisms for defined mixtures of samples with known aneuploidies.
The results also show that Embgenix PGT-A accurately determines the size of CNVs in segmental aneuploidies involving a wide array of different chromosomal regions. Testing in independent clinical laboratories using both gDNA and TE and ICM biopsies has shown concordance between results from Embgenix PGT-A and results from established approaches for NGS-based PGT-A.
Taken together, the results clearly show the feasibility of application of Embgenix PGT-A and establish the kit as a viable solution for current and future PGT-A applications.
Materials and Methods
Sample collection
For experiments performed by Takara Bio's in-house laboratory, cell lines with defined segmental aneuploidies were purchased from Coriell Biorepository (USA) as reported in Table 3. 26 TE biopsies were obtained by Clinical Laboratory B. A total of 71 embryos were included in the study conducted by Clinical Laboratory C. For each embryo, multiple biopsies were taken from the trophectoderm (TE) or inner cell mass (ICM).
Table 3. Panel of Coriell gDNA samples containing segmental aneuploidies
Coriell ID
Description
Size (Mb)
NA05966
Duplicated chromosome
21.2
NA06226
Translocated chromosome
21.3
NA06870
Aneuploid chromosome number - non-trisomic
15.4
NA08331
Chromosome deletion
12.1
NA09216
Chromosome deletion
16.7
NA09367
Duplicated chromosome
35.2
NA10800
Chromosome deletion
25.2
NA10989
Gilles de la Tourette syndrome (GTS)
Chromosome deletion
12.0
NA11213
Chromosome deletion
17.5
NA11672
Chromosome deletion
26.2
NA12606
Aneuploid chromosome number - non-trisomic
41.2
NA13019
Chromosome deletion
Turner syndrome
91.4, 56.8
NA14164
Tetralogy of Fallot
Chromosome deletion
41.2
NA14485
Inverted duplication deletion
7.1, 31.1
NA14943
Chromosome deletion
7.8
NA16362
Aneuploid chromosome number - trisomy
8.0
NA20022
Duplicated chromosome
61.1
NA20556
Isodicentric chromosome
12.3
Whole genome amplification
Samples were processed following the Embgenix PGT-A protocol. The kit employs a single-tube protocol for the amplification of genomic DNA starting from samples stored in liquid N2, a standard practice for WGA starting material in this field.
Sequencing
Sequencing-ready libraries were pooled and sequenced using a MiSeq® instrument with 24 samples per flow cell or using a NextSeq® instrument with 96 samples per flow cell.
Genomic data analysis and aneuploidy screening
Sequencing data were analyzed using Embgenix Analysis Software.
References
Kemper, J. M. et al. Preimplantation Genetic Testing for Aneuploidy: A Review. Obstet Gynecol Survey74(12), 727–737 (2019).
Vendrell, X. et al. New protocol based on massive parallel sequencing for aneuploidy screening of preimplantation human embryos. Systems Biology in Reproductive Medicine63(3), 162–178 (2017).
Zhang, X. et al. The comparison of the performance of four whole genome amplification kits on ion proton platform in copy number variation detection. Bioscience Reports 37 BSR20170252 (2017)